Manufacturing Productivity Index (SXI)
SCORE + CORRELATE = IMPROVE
Current SXI Score
3.4
Current Fabric Production
3794
Fabric Production Prediction Accuracy
99.99%
Target SXI Score
4.55
Target Fabric Production
(20%) 4553
Fabric Production Prediction Precision
98.98%
Potential Business Improvements
Current Fabric Production = 3794
Improvement
20% or 1381 more
Fabric Production
Improvement
200% or 13,802 more
Fabric Production
Improvement
441.3% or 30,454 more
Fabric Production
| Auto-ML | SXI | |
|---|---|---|
| Accuracy (%) | 96 | 99.99 % |
| Precision (%) | 95.50 | 98.98 % |
| AUC | 0.96 | 0.99 |
| True Positives = 9704 | False Positives = 2 |
|---|---|
| False Negatives = 0 | True Negatives = 14524 |
| ID | SXI Score | Actual Target | Predicted Target |
|---|---|---|---|
| 641 | 3.191 | Low Production | Low Production |
| 52 | 3.389 | High Production | Low Production |
| 457 | 3.323 | Low Production | Low Production |
| 37 | 4.126 | High Production | High Production |
| 58 | 3.431 | High Production | Low Production |
| 944 | 2.646 | Low Production | Low Production |
| 342 | 3.728 | High Production | High Production |
| 497 | 3.135 | Low Production | Low Production |
| 237 | 4.226 | High Production | High Production |
| 294 | 4.437 | High Production | High Production |
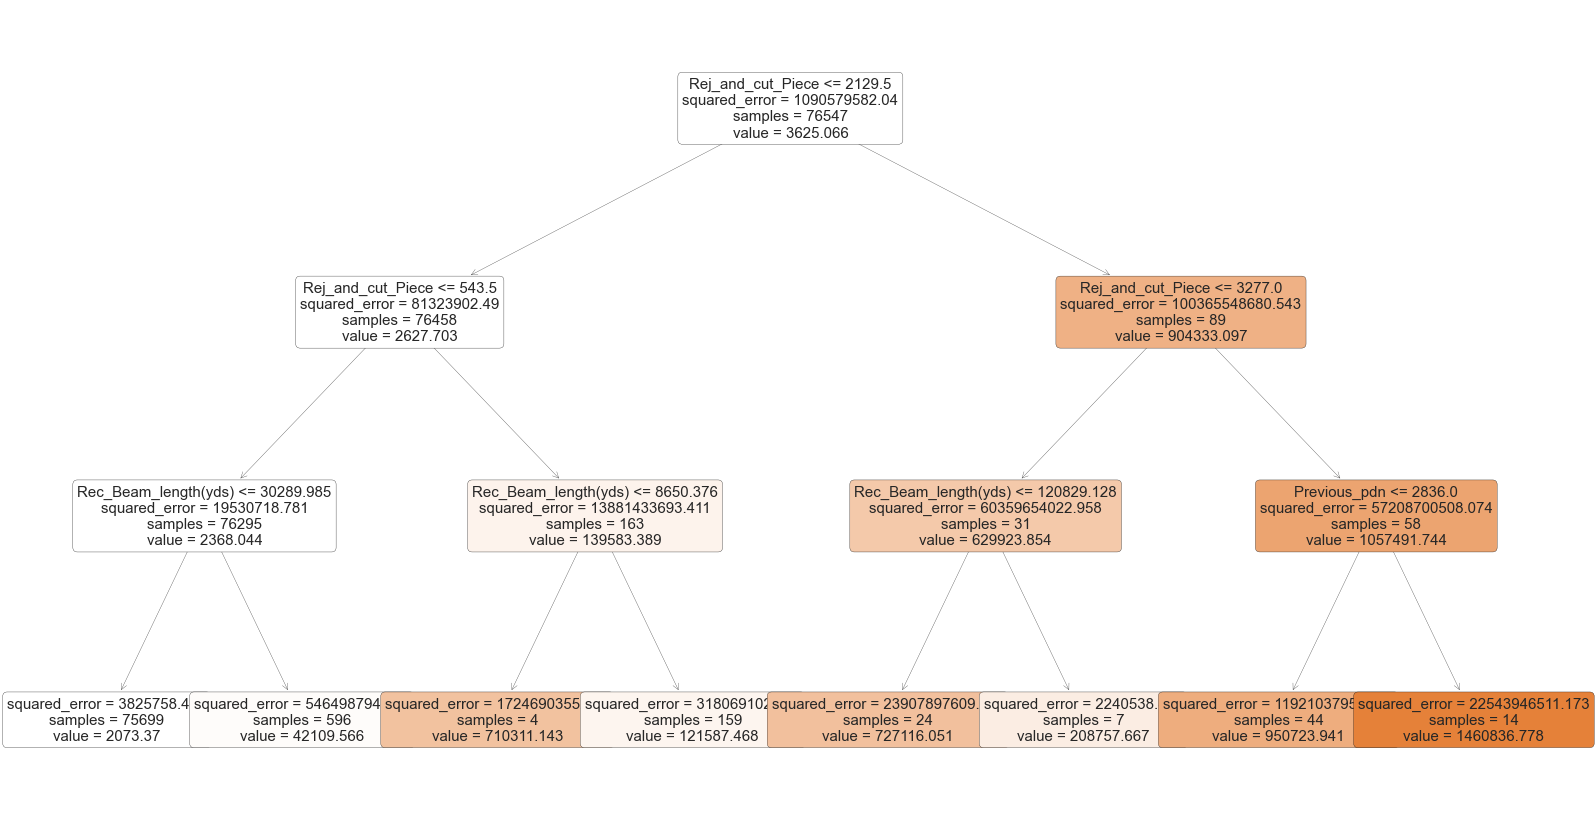
Current Fabric Production Decision Tree
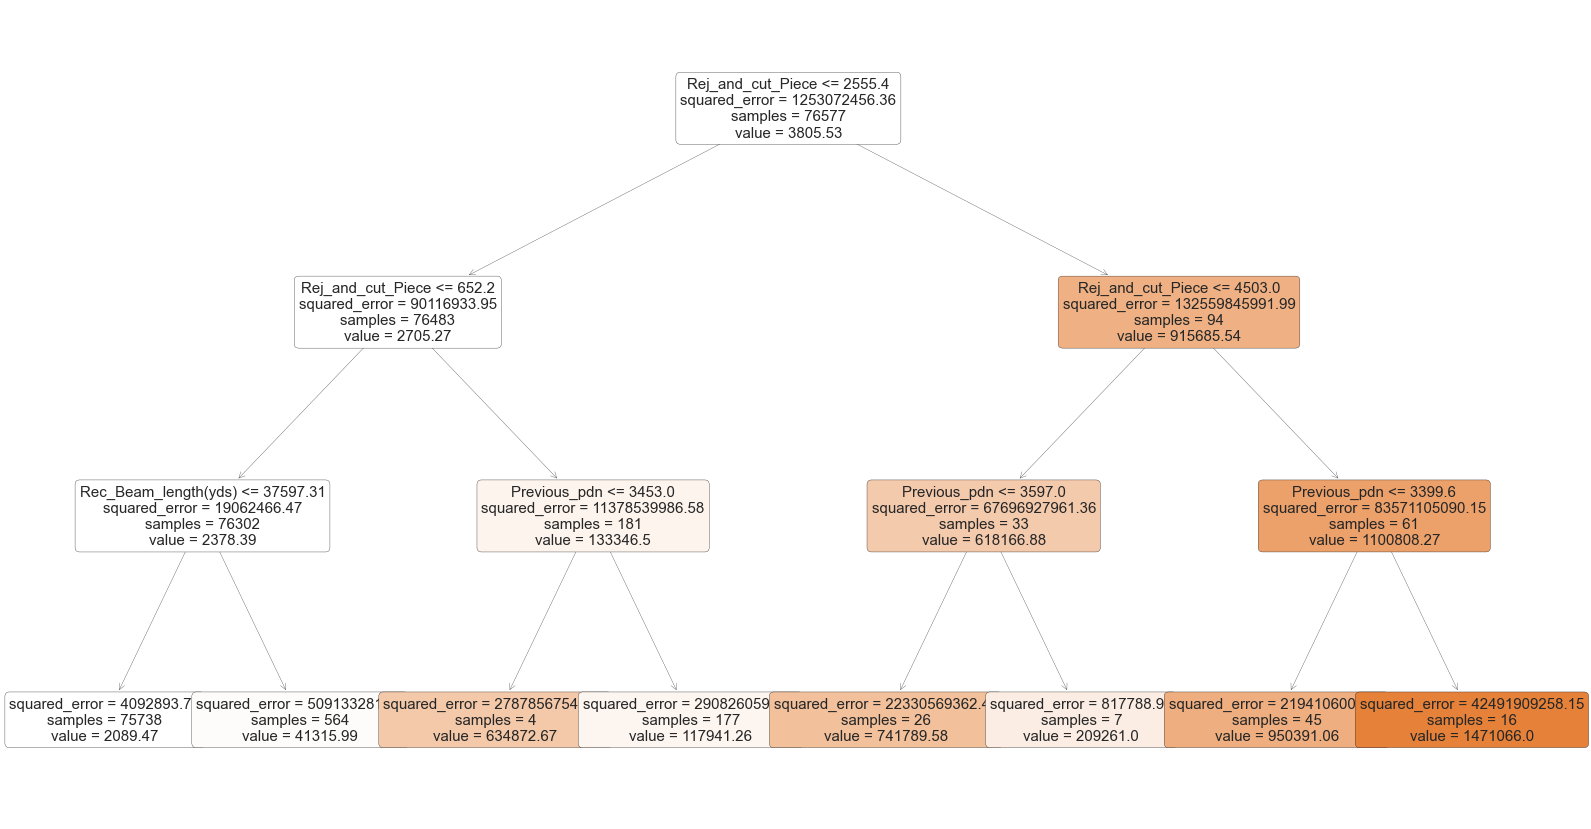
Target Fabric Production Decision Tree
Sensitivity Analysis
| FEATURES | epi | ppi | Construction | weft_count | Req_grey_fabric | Total_pdn_m/c_state |
|---|---|---|---|---|---|---|
| Actual Values | 120 | 80 | 38 | 40 | 4251.36 | 0 (low production) |
| Adjusted Values | 192 | 151.2 | 17.1 | 64.0 | 2890.92 | 1 (high production) |
| Change in values (%) | 60 | 89 | -55 | 60 | -32 | - |
The target variable changed from Low Production (Prediction in Actual Data) to High Production (Prediction in Adjusted Data).
Fabric Allowance
8.23
act_crimp
9769.63
Previous_pdn
1983.00
PPI
84.01